The user indicates his sites of interest (points or polygons in shapefile format), the period and chooses the indices to be calculated. The application then executes this query on a server and sends the result in csv format directly by email. After receiving the email, the user will be able to open each csv produced to display the table in the Data tab or in graphical form in the Chart tab.
1- Import your zipped shapefile: Thanks to the upload button you can import your shapefile. It can contain points or polygons and must be zipped. When imported, it will automatically be reprojected in WGS84 (EPSG:4326). Only one zip file can be imported at a time. Here is an example shapefile you can use
2- Choose the desired index(s): Sen2Extract application proposes 4 spectral indices that can be selected separately or together.
- NDVI : vegetation index by standardized difference. This index is sensitive to the vigor and quantity of vegetation.
- NDWIGAO : Aimed at monitoring changes in leaf water content, using near-infrared (NIR) and short-wave infrared (SWIR) wavelengths, proposed by Gao in 1996.
- NDWIMCF : Aims to monitor changes in water content in water bodies, using green and near-infrared (NIR) wavelengths, defined by McFeeters in 1996.
-MNDWI: Modified Normalized Difference Water Index is an effective index to highlight the presence of water.
3- Select your period: a calendar allows you to choose your dates. You can easily switch from a weekly, monthly or yearly view by clicking on the date at the top of the calendar.
Depending on the size of your shapefile and / or the selected period, the processing time may be quite long. Please make sure your popup blocker is disabled for this website; once processing is complete it will try to automatically download to your computer.
Sen2Extract is a R Shiny web application allowing to extract time series of spectral indices (previously calculated from Sentinel-2 L2A satellite images) for the requested locations and dates. This can only extract values from images already available in the database.
Origin of Sentinel-2 L2A data
Sentinel-2 images are provided freely by the Copernicus Programme developed and operated by the European Space Agency (ESA). These optical images are acquired by two polar-orbiting satellites : Sentinel-2A was launched on 23 June 2015 and Sentinel-2B on 7 March 2017. They have a high spatial resolution (10 m to 60 m) and high temporal repetitivity (every 5 days) over land and coastal waters. The indices provided by Sen2Extract are calculated from Sentinel-2 L2A images (i.e. after atmospheric, terrain and cirrus corrections).
Technical Details
Indices are calculated at KHEOBS using Sen2Chain (https://framagit.org/espace-dev/sen2chain), which is a simple utility to download and process Sentinel-2 images. It uses the sentinelsat and peps_download packages to find and download data, and ESA's Sen2Cor processor to perform atmospheric, terrain and cirrus correction.
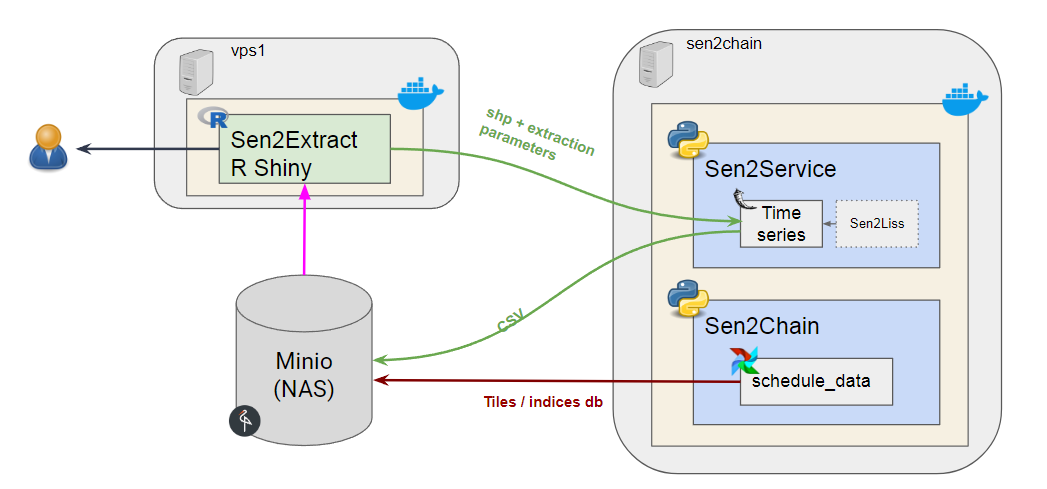
The calculation and hosting of Sentinel2 indices are done through a blend of technologies including batch processing with Airflow , data storage and retrieval with MinIO S3 , an internal REST api created with Flask , and finally orchestration with Docker . The following diagram illustrates the architecture:
Sen2Chain and Sen2Extract were initially developed by UMR ESPACE-DEV (IRD, Univ Antilles, Univ Guyane, Univ Montpellier, Univ Réunion) at University of La Réunion – SEAS-OI Station, in the frame of the S2-Malaria Project, funded by CNES (TOSCA 2017-2020). Sen2Chain aims at producing time series of spectral indices, calculated with Sentinel-2 satellite images. Sen2Extract is a simple web interface to allow any user to simply query these time series without technical knowledge related to remote sensing.
The implementation of Sen2Chain and Sen2Extract and their further development were conducted under the PREACTS AfriCam-Cambodia project (funded by AFD), at the Khmer Earth OBServation Laboratory (collaboration between IRD and ITC) at the Institute of Technology of Cambodia. This tool aims to provide access to ready-to-use time series of Sentinel-2 spectral indices to any user in Cambodia to further implement One-Health studies or any environmental-related study. Therefore, the full archive of Sentinel-2 images for Cambodia is stored and regularly updated at KHEOBS.